January 2026 Rutherford County TN Housing Market Update
This January 2026 Rutherford County TN housing market update breaks down what is happening with single family homes across Rutherford County, Tennessee, using clear numbers and simple takeaways. If you are buying, selling, or even just curious about your home’s value this year, this snapshot will help you understand where the market is heading.
At a glance
Here is the quick read before we get into the details.
- New listings: down
- Homes going under contract: up
- Active inventory: up
- Pending inventory: up slightly
- Closings: up slightly
- Median sale price: essentially flat
- Months of supply: up, market is leaning more balanced
What this market update covers
This update looks at the Rutherford County real estate market using seven key metrics, comparing January 2026 to January 2025. These stats help answer the questions people are searching every day, like:
- Are there more homes for sale in Rutherford County TN right now
- Are buyers still making moves
- Are Rutherford County TN home prices rising or cooling
- Is the market shifting toward buyers or sellers
- You will also see what these numbers mean in real life, not just what they are on paper.
Two quick definitions that make the stats easier
What “months of supply” means
Months of supply estimates how long it would take to sell the current number of homes on the market at the current pace of sales. Higher months of supply usually means buyers have more options and sellers need to be sharper with pricing and presentation.
What “under contract” tells us
Homes that are under contract are essentially “in motion.” They have a buyer and a signed agreement, even though they are not closed yet. This is one of the best indicators of buyer demand because it shows people are not just browsing, they are committing.
The 7 key stats for Rutherford County, January 2026 vs January 2025
1. New Listings
January 2026: 564
January 2025: 752
New listings dropped compared to last year. That means fewer homeowners chose to put their homes on the market this January. In many cases, this happens when homeowners are unsure about timing, or they feel comfortable staying put.
The interesting part is that fewer listings does not automatically mean fewer sales. It simply means the market has fewer fresh options entering the pool, which can keep well priced homes moving.
Bottom line: Fewer new listings can keep demand focused on the best homes.

2. New Under Contract
January 2026: 343
January 2025: 302
More homes went under contract this January than last year, even with fewer new listings. That signals steady buyer demand. Buyers are still making decisions when the right home appears.
It also suggests the market is not frozen. In fact, the contract activity shows that buyers are active, they are just more selective than they were in the peak frenzy years.
Bottom line: Buyers are still buying, and contracts are happening.

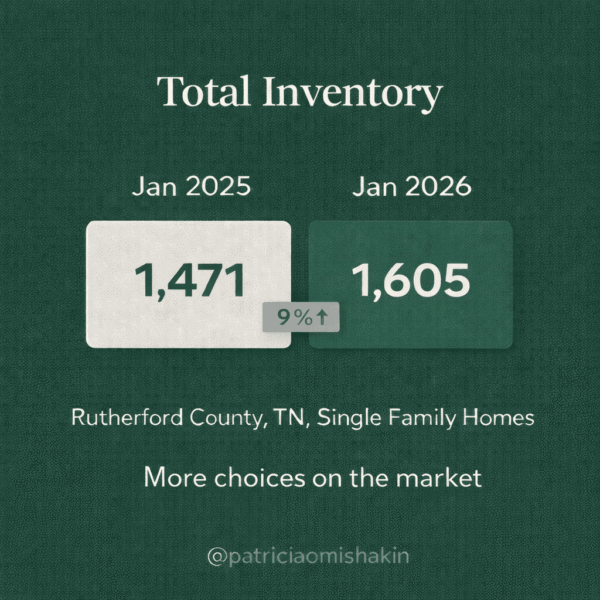
3. Active Inventory Average
January 2026: 1,094
January 2025: 975
Active inventory rose, which means there were more homes available for buyers to choose from. This is one of the most practical shifts for everyday people because it changes how negotiations and timing feel.
When inventory rises, buyers can shop with a little more breathing room. Sellers can still win, but they usually need a better plan, better pricing, or better presentation to stand out.
Bottom line: Buyers have more choices than they did last year.

4. Under Contract Inventory Average
January 2026: 511
January 2025: 496
Under contract inventory increased slightly. That means the “pipeline” of homes that are expected to close is a bit stronger than last year.
This number matters because it helps confirm whether contract activity is steady enough to carry through into closings. In other words, it supports the idea that the market is moving, not just generating showings.
Bottom line: The pending pipeline is steady, the market is still moving.
5. Closings
January 2026: 248
January 2025: 239
Closings increased slightly year over year. That is a good sign for market stability because it means deals are making it to the finish line.
Even when buyers are cautious, closings show that people are still relocating, changing life stages, and moving forward with purchases in Rutherford County.
Bottom line: Transactions are still getting done.

6. Median Sale Price
January 2026: $442,500
January 2025: $443,659
The median sale price is essentially flat compared to last January, with a small dip. This is important because it suggests Rutherford County pricing is holding steady rather than swinging sharply.
For sellers, this is a reminder that the market rewards correct pricing and strong presentation more than optimism. For buyers, steady pricing often means you can focus on the right home and the right terms, instead of waiting for a dramatic drop that may not come.

7. Months of Supply
January 2026: 5.21
January 2025: 4.67
Months of supply rose, which signals a shift toward a more balanced market. More supply generally means buyers gain negotiating power, and sellers need to approach the market with a stronger plan.
This does not mean values are collapsing. It usually means the market is normalizing. Homes can still sell quickly, but typically the ones that are priced right and show well.
Bottom line: The market is leaning more balanced than last year.

What this means for buyers in Rutherford County
If you are searching homes for sale in Rutherford County TN, here is the practical takeaway from these numbers.
- You have more options than last year because active inventory is higher.
- You may have more negotiating room, especially when a home is overpriced or needs updates.
- Strong homes still move, because new under contract activity is up.
- Stable median pricing means you can plan with more predictability, rather than guessing.
- Pay attention to inventory pockets. Some neighborhoods or price points may still feel competitive while others feel slower.
- Get your plan tight before you tour. In a market with more inventory, the advantage goes to buyers who know their numbers and act quickly when the right home appears.
Buyer scenario example
If you are shopping in the low to mid 400s, more inventory often means you can be pickier about layout, condition, and location. But the best homes still go under contract, so being prepared matters.
What this means for sellers in Rutherford County
If you are thinking about selling, this Rutherford County TN housing market update points to one big message: you can still sell well, but you need a plan.
With more inventory, buyers will compare your home against more options.
Pricing matters more now. Overpriced homes sit, even if the market is active overall.
Even though new listings are down, contract activity is up, so buyers are still writing offers.
With higher months of supply, expect more buyer questions and sometimes more negotiation.
The easiest way to win is to make your home the obvious best option for the price.
Seller scenario example
If a similar home down the street sat last month, it does not always mean buyers disappeared. It often means the home was not positioned correctly. Price, condition, and presentation usually decide the outcome.
What I am watching next month
For February, here are the three things I will be watching closely.
- New listings: Are more homeowners choosing to list as the year warms up
- New under contract: Does buyer demand keep pace
- Months of supply: Does inventory continue rising toward a more balanced market
If you follow these three, you can usually predict whether the market is tightening or loosening.
Quick market summary
This Rutherford County TN housing market update shows a market that is still active, with signs of balance increasing. New listings fell, but homes going under contract rose. Inventory and months of supply increased, giving buyers more options and requiring sellers to be more strategic. Pricing is stable overall, and closings are still happening.
FAQ, Rutherford County TN housing market
How is the Rutherford County TN housing market right now
It is active and leaning more balanced than last year, with higher inventory and steady pricing.
Are more homes going under contract in Rutherford County
Yes. January 2026 had 343 new homes go under contract, compared to 302 in January 2025.
Is inventory rising in Rutherford County
Yes. Active inventory average rose to 1,094 from 975 last year. Months of supply increased too.
Are Rutherford County TN home prices rising or falling
Prices are stable. The median sale price was $442,500 in January 2026 compared to $443,659 last year.
If you are thinking about buying or selling in 2026, do not rely on county wide averages alone. The numbers can look very different from one neighborhood, price point, or type of home to another.
Message me the word “Rutherford” and tell me the area you care about, and I will send you a quick personalized snapshot for your neighborhood or your target price range. If you prefer, you can call or text me at 615 730 0037 and I will help you map out the smartest next step.
Source: Local MLS data, Rutherford County, TN, single family residential, January 2026.

Patricia Omishakin
Realtor at Elam Real Estate, serving Smyrna and Middle Tennessee
I help people plan their next move with clarity, whether you’re relocating, buying new construction, or exploring 55+ living and downsizing in Middle Tennessee.
#CallPatToChat • Smyrna • Murfreesboro • Nashville • Franklin